MACROECONOMY & END-USE MARKETS
Running tab of macro indicators: 10 out of 20
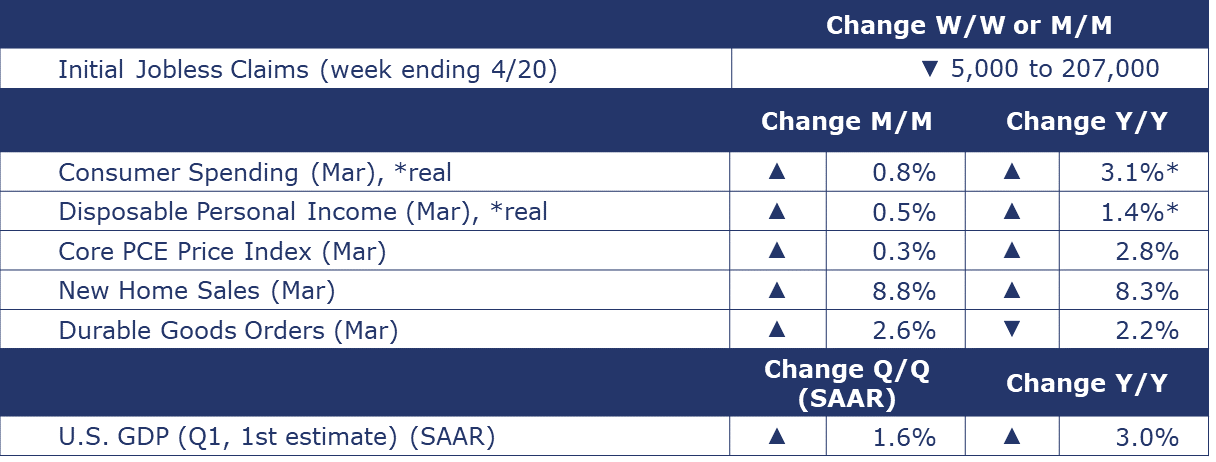
The number of new jobless claims fell by 5,000 to 207,000 during the week ending April 20. Continuing claims fell by 79,491 to 1.87 million, and the insured unemployment rate for the week ending April 13 was unchanged at 1.2%.
Consumer spending surged for a second month in March with another 0.8% gain. In dollar terms, the gain in spending was evenly divided between goods and services. Aggregate personal income also expanded with a solid 0.5% gain, largely reflecting growth in employee compensation from a tight labor market. Compared to a year ago, real (inflation-adjusted) consumer spending was up 3.1% while real personal income grew 1.4% Y/Y.
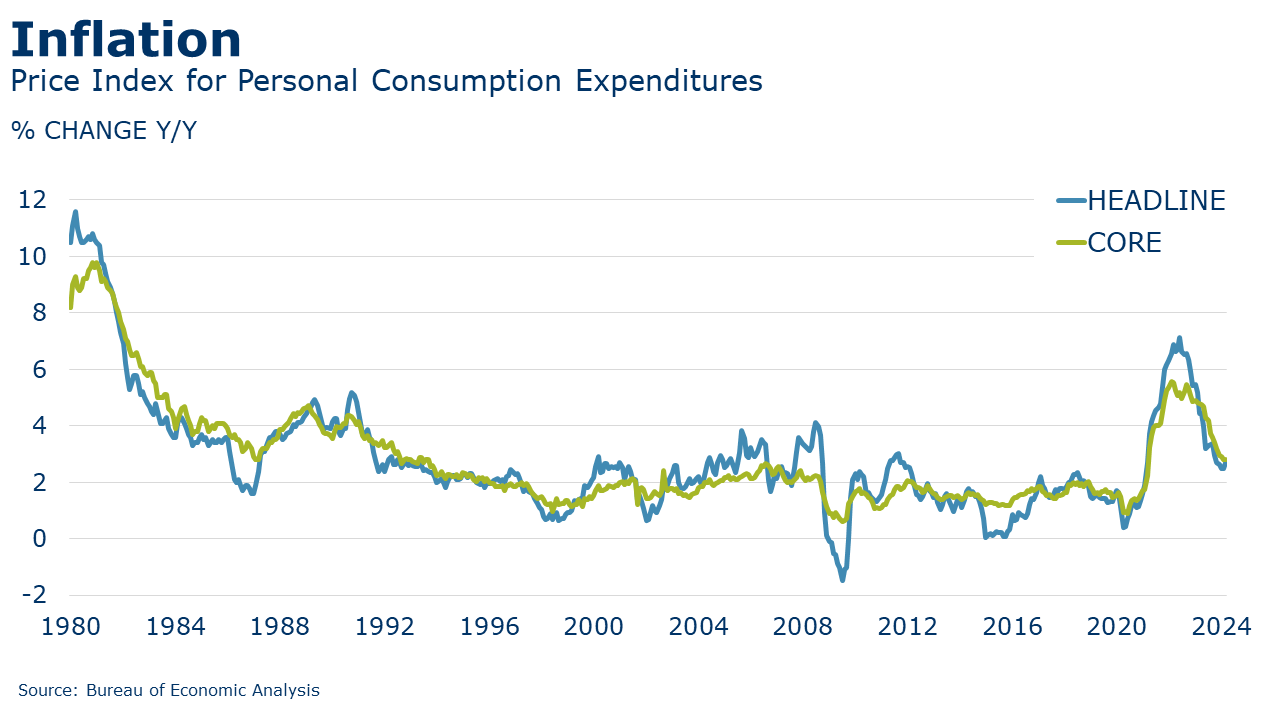
The price index for personal consumption expenditures (PCE) rose by 0.3% and was up 2.7% Y/Y (an acceleration compared to the previous three months). Excluding the volatile food and energy components, the core PCE price index also moved higher by 0.3% and was up 2.8% Y/Y. Stubborn inflation creates headwinds for the Fed’s plan to start cutting interest rates.
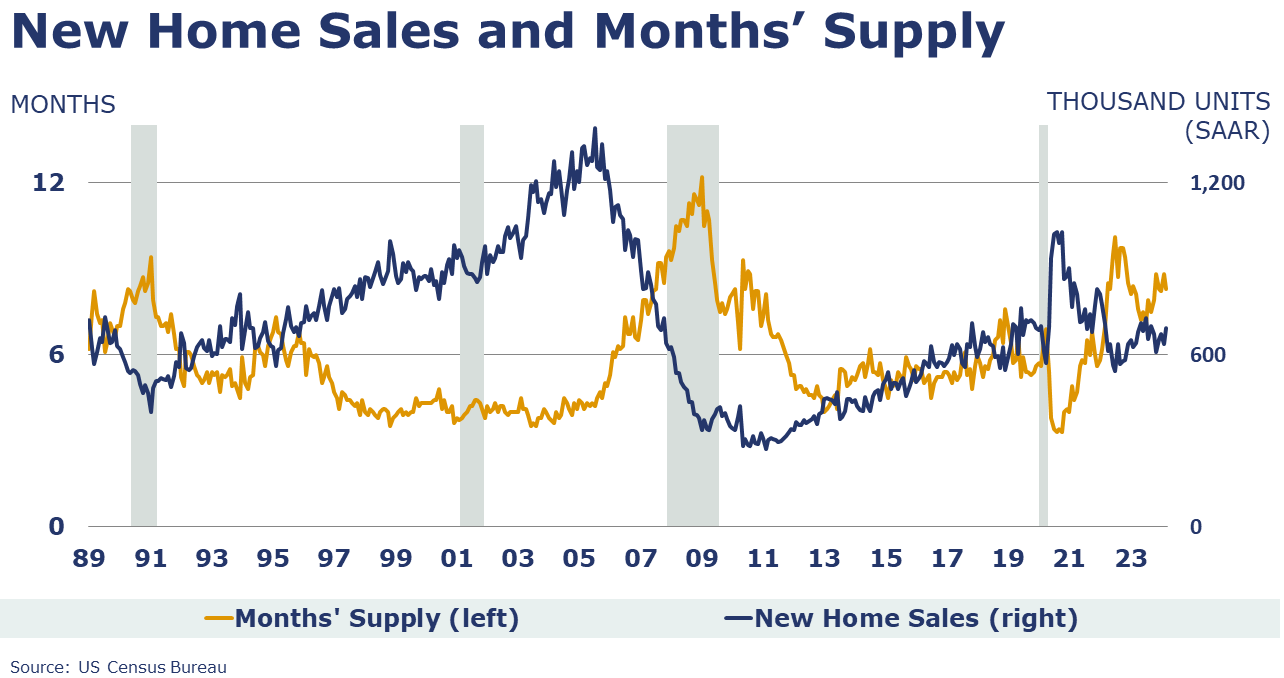
New home sales rose 8.8% to a 693,000 seasonally adjusted annual rate in March. The number of unsold homes available for sale rose 2.6% to 477,000, the highest level since 2008. That inventory represented an 8.3-month supply at the current sales rate. That was down from an 8.8-month supply in February, but up from 8.1 months a year ago. The median sales price was 1.9% lower Y/Y to $430,700, the seventh consecutive Y/Y decline.
In its first of three estimates, BEA announced that Q1 GDP rose at an annualized pace of 1.6%. Consumer spending slowed compared to the previous two quarters but came in at a solid 2.5% rate. Spending on services accelerated while spending on goods eased. Nonresidential fixed investment grew at a slower pace while residential fixed investment rose strongly. Government spending slowed. There were negative contributions from lower inventories and net trade. Export growth slowed while imports (which count as a negative contribution) rose strongly. GDP was up 3.0% Y/Y. The price index for GDP rose at a 3.1% annualized pace, higher than Q4 2023 and the PCE price index rose at a 3.4% annual rate, higher than the previous three quarters. Excluding food and energy, both measures also accelerated.
Durable goods orders jumped in March, up by 2.6%. A typically choppy series, the gain was led by a surge in orders for civilian aircraft. Orders were also higher for motor vehicles and parts, electronics (including semiconductors) and fabricated metal products. Orders for core business goods (nondefense capital goods excluding aircraft) continued to expand by 0.2%. Compared to a year ago, headline orders were off 2.2% while core business orders were slightly lower by 0.8%.
ENERGY
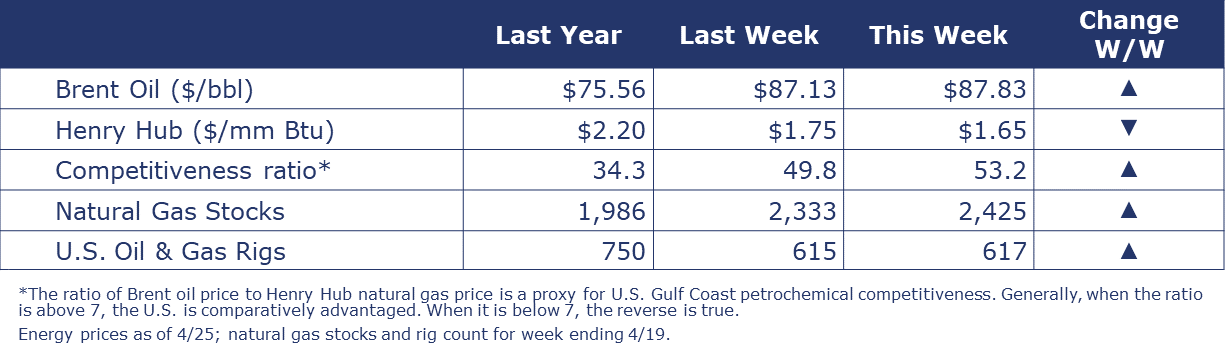
Oil prices were slightly higher than a week ago. U.S. natural gas prices remain at historically low levels. While good for consumers (including U.S. manufacturers), the persistently low price has taken a toll on the rig count. Gas directed rigs have fallen from 120 at the end of the year to 106 during the week ending 19 April. Including oil-directed rigs, the combined rig count rose by 2 to 617 last week.
CHEMICALS
Indicators for the business of chemistry bring to mind a yellow banner.

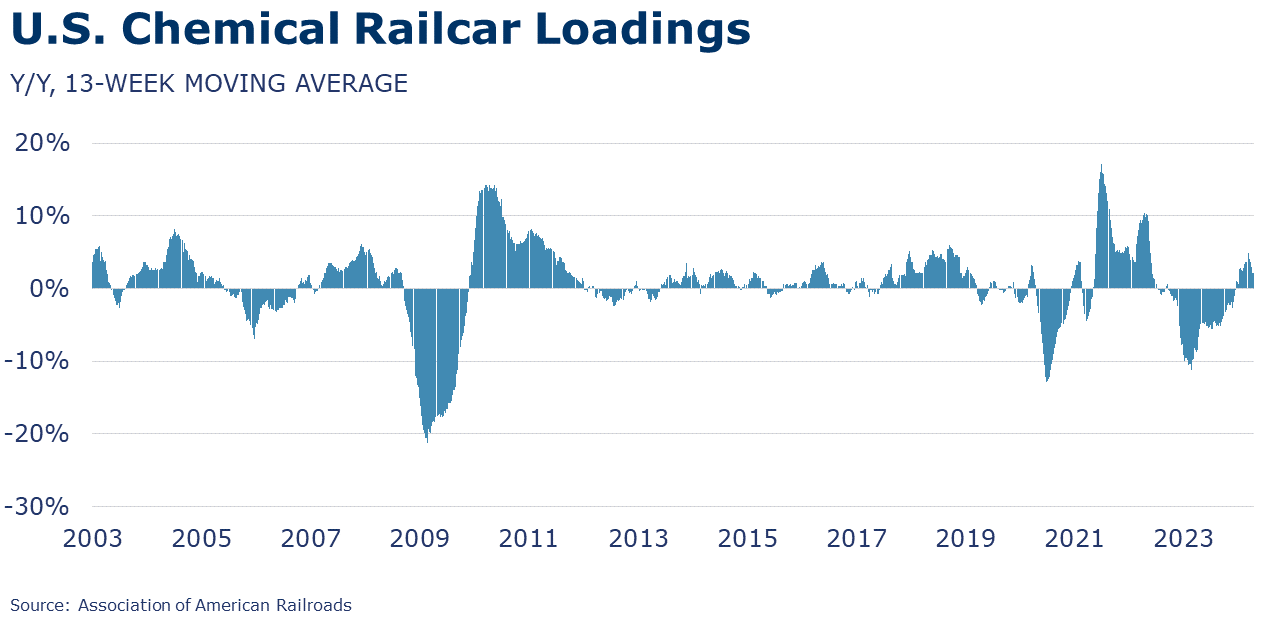
According to data released by the Association of American Railroads, chemical railcar loadings were up to 33,579 for the week ending April 20. Loadings were up 2.7% Y/Y (13-week MA), up (4.1%) YTD/YTD and have been on the rise for 8 of the last 13 weeks.
Note On the Color Codes
Banner colors reflect an assessment of the current conditions in the overall economy and the business chemistry of chemistry. For the overall economy we keep a running tab of 20 indicators. The banner color for the macroeconomic section is determined as follows:
Green – 13 or more positives
Yellow – between 8 and 12 positives
Red – 7 or fewer positives
There are fewer indicators available for the chemical industry. Our assessment on banner color largely relies upon how chemical industry production has changed over the most recent three months.
For More Information
ACC members can access additional data, economic analyses, presentations, outlooks, and weekly economic updates through ACCexchange.
In addition to this weekly report, ACC offers numerous other economic data that cover worldwide production, trade, shipments, inventories, price indices, energy, employment, investment, R&D, EH&S, financial performance measures, macroeconomic data, plus much more. To order, visit http://store.americanchemistry.com/.
Every effort has been made in the preparation of this weekly report to provide the best available information and analysis. However, neither the American Chemistry Council, nor any of its employees, agents or other assigns makes any warranty, expressed or implied, or assumes any liability or responsibility for any use, or the results of such use, of any information or data disclosed in this material.
Contact us at ACC_EconomicsDepartment@americanchemistry.com.