MACROECONOMY & END-USE MARKETS
Running tab of macro indicators: 6 out of 20

Higher-than-anticipated job gains continued into February as nonfarm payrolls expanded by 311,000. February’s gain was a bit lower than the 6-month average of 343,000. While January’s surge was revised slightly downward to 504,000, the data suggest that the labor market remains stubbornly resilient in the face of higher interest rates. The bulk of job gains were in the expanding services segment of the economy, including leisure & hospitality, retail trade, government, and health care. Manufacturing lost 4,000 jobs, the first decline since April 2021. Average hourly earnings rose 4.6%, up from January’s 4.4% increase, but still lower than all of 2022. The unemployment rate moved higher from an historic low 3.4% in January to 3.6% in February. The increase in the unemployment rate reflects growth in the labor force that exceeded employment growth. While still well below its pre-pandemic levels, the participation rate edged higher to 62.5% in February, the highest in nearly three years.
The number of job openings in the U.S. economy fell by 400,000 in January to 10.8 million. Compared to the number of unemployed, that represents 1.9 jobs per unemployed person, down from 2.0 in December. Comparing the number of jobs available in the economy (the number of employed plus the number of job openings) to the number of workers in the economy (the number of employed plus the number of unemployed who would like to work), there remains a gap of over 5.1 million more jobs available than workers. While historically high, the gap is down from 5.5 million in December. The report suggests that the labor market may be starting to cool following nearly a year of Fed efforts to rein in inflation and dampen demand.
The number of new jobless claims rose by 21,000 to 211,000 during the week ending 4 March. Continuing claims increased by 69,000 to 1.7 million, and the insured unemploymentrate for the week ending 25 February was up 0.1 percentage point to 1.2%.

At the wholesale level, sales rose 1.0% in January following a 0.2% decline in December. Higher sales of automotive, metals, electrical, machinery, drugs, alcohol, and petroleum goods offset lower sales of computer equipment, lumber, paper, and chemicals. Wholesale inventories edged slightly lower, down 0.4%, following a 0.1% gain in December. Sales were up 3.6% Y/Y while inventories were up 15.8% Y/Y. The inventories-to-sales ratio ticked down slightly to 1.34 compared to December but was up from 1.20 in January 2022. Among the categories with the largest monthly increase in the inventories-to-sales ratio were furniture, hardware, machinery, and apparel.
Led by a steep decline in the volatile aircraft segment, headline factory orders fell by 1.6% in January. Excluding aircraft, there were gains across a number of segments, including ICT, construction supplies, consumer nondurables, and motor vehicles and parts. Core business orders (nondefense capital goods excluding aircraft) rose by 0.8% following declines the previous two months. Unfilled orders (a measure of the manufacturing pipeline) were flat. Manufacturing shipments rose 0.7% following two months of declines while inventories were flat in January, following a 0.4% gain in December. The manufacturing inventories-to-sales ratio edged lower from 1.49 in December to 1.48 in January.
The U.S. trade deficit in goods and services rose 1.6% to $68.3 billion in January. Exports rose 3.4% while imports rose 3.0%. Both imports and exports of goods increased in January with gains in consumer goods, capital goods and auto and auto parts. Trade in auto and auto parts – both imports and exports – was the highest on record. Exports of capital goods and consumer goods were also at record highs.
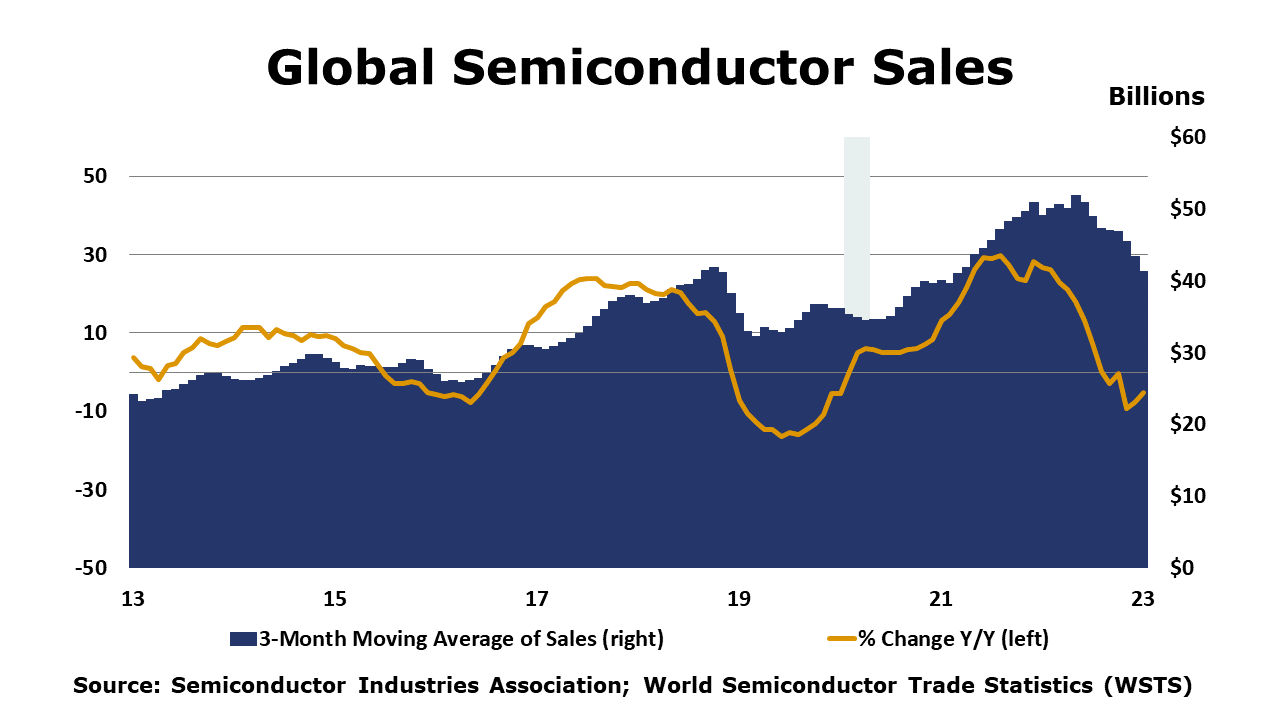
Global semiconductor sales fell by 5.2% in January to $41.3 billion. Sales were lower in all regions, except Europe, where sales increased by 0.6%. Compared to last January, sales were down by 18.5%. SIA noted that the global semiconductor market cooled off considerably during the second half of the year and the trend continued into the first month of 2023.
Federal Reserve Beige
The Fed’s Beige Book is a compilation of regional assessments of economic conditions in each of the 12 Federal Reserve Districts. Some key take-aways follow here:
- Overall economic activity increased slightly in early 2023. Six Districts reported little or no change in economic activity since the last report, while six indicated economic activity expanded at a modest pace.
- On balance, supply chain disruptions continued to ease.
- Consumer spending generally held steady, though a few Districts reported moderate to strong growth in retail sales during what is typically a slow period.
- Auto sales were little changed, on balance, though inventory levels continued to improve.
- Several Districts indicated that high inflation and higher interest rates continued to reduce consumers' discretionary income and purchasing power, and some concern was expressed about rising credit card debt.
- Travel and tourism activity remained fairly strong in most Districts.
- Manufacturing activity stabilized following a period of contraction.
- While housing markets remained subdued, restrained by exceptionally low inventory, an unexpected uptick in activity beyond the seasonal norm was seen in some Districts along the eastern seaboard. Commercial real estate activity was steady, with some growth in the industrial market but ongoing weakness in the office market.
- Demand for nonfinancial services was steady overall but picked up in a few Districts.
- On balance, loan demand declined, credit standards tightened, and delinquency rates edged up.
- Energy activity was flat to down slightly, and agricultural conditions were mixed.
- Amid heightened uncertainty, contacts did not expect economic conditions to improve much in the months ahead.
ENERGY
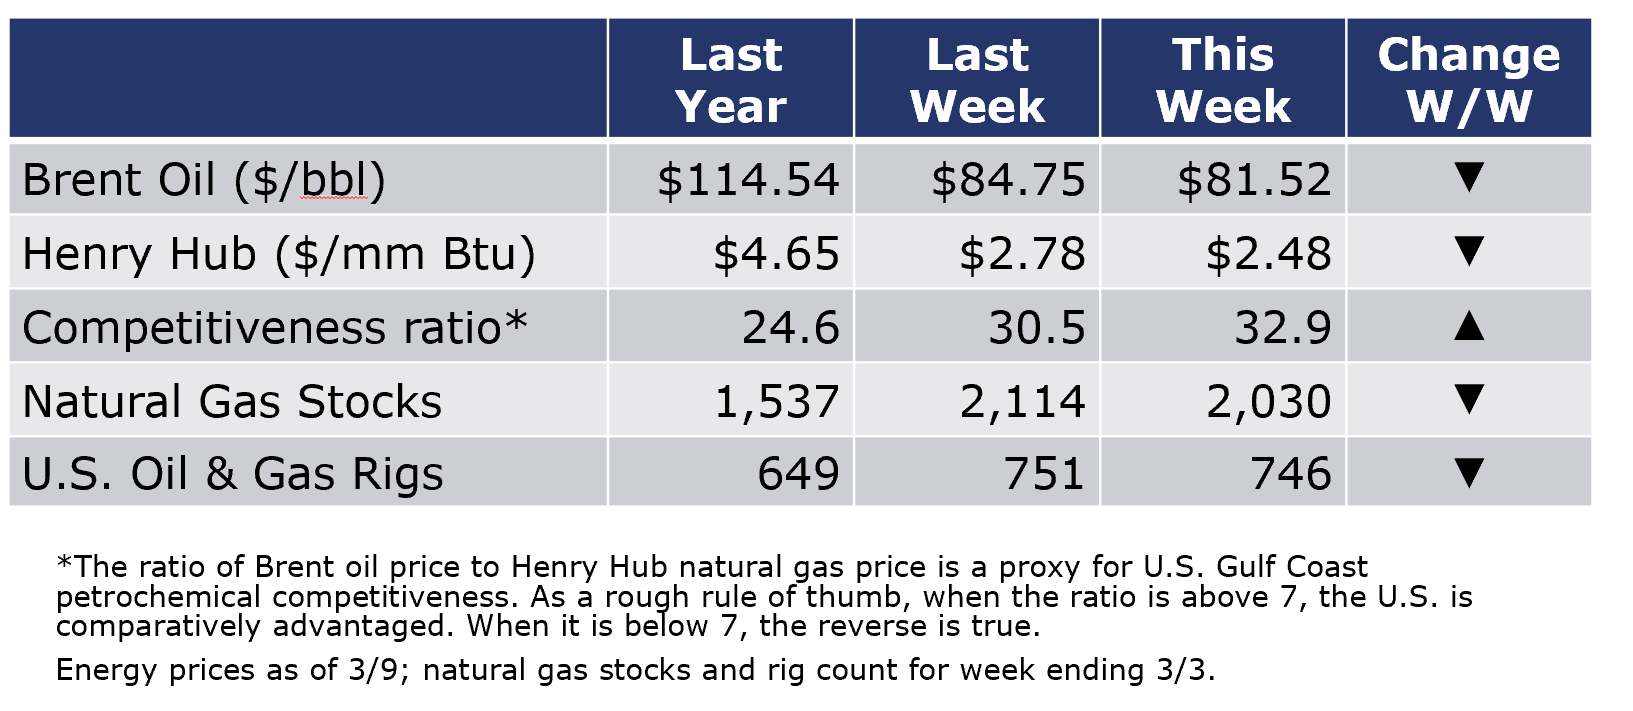
Oil prices were lower amid hawkish statements by Fed Chairman Powell that interest rates could move higher and possibly at a faster rate than previously anticipated. Natural gas futures were also lower on a warmer weather forecast. The combined oil and gas rig count fell by five to 746 during the week ending March 3.
CHEMICALS
While we’re still posting red for chemicals this week, there is definitely an orange hue as some chemical indicators are starting to improve.
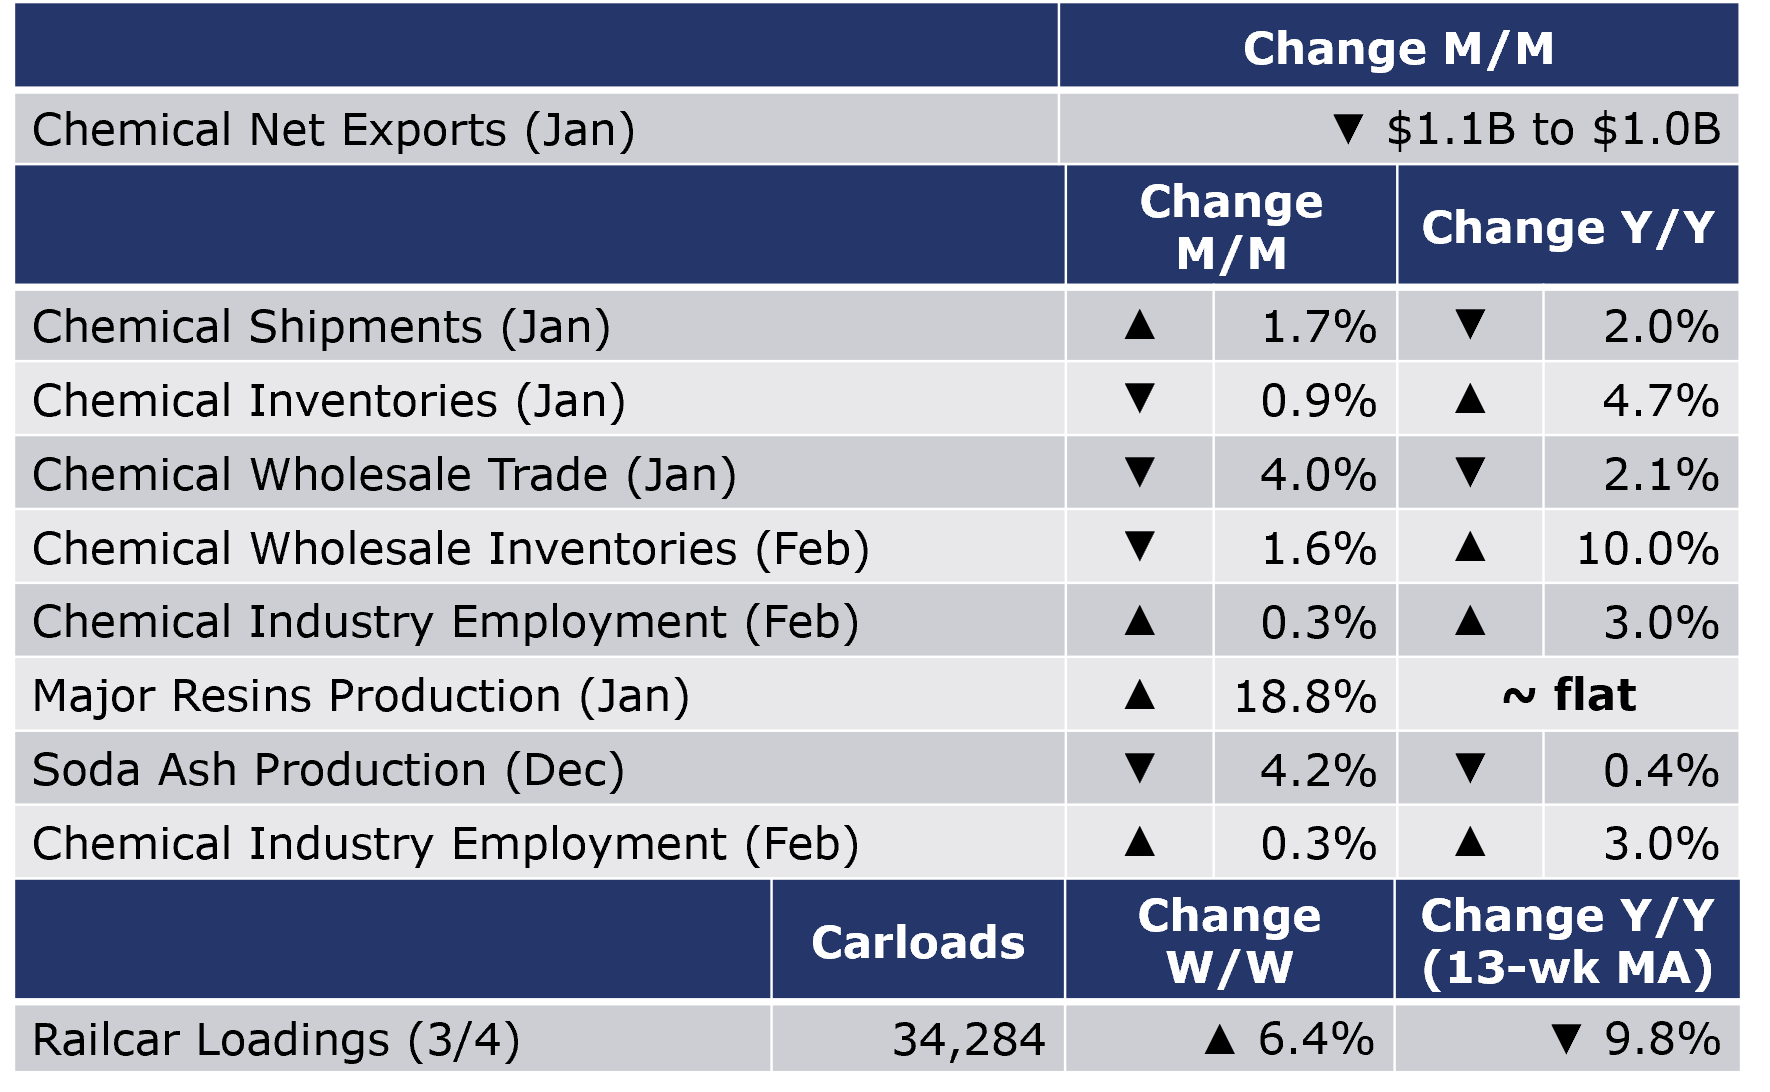
According to data released by the Association of American Railroads, chemical railcar loadings were up 6.4% to 34,284 for the week ending 4 March. Loadings were down 9.8% Y/Y (13-week MA), down 7.3% YTD/YTD and have been on the rise for 9 of the last 13 weeks.
Comments in the Federal Reserve Beige Book related to chemicals included, “Crude oil refining and petrochemical manufacturing contacts continued to report strong demand, although contacts noted that demand for chemicals related to adhesives and steel manufacturing fell.”
Following four consecutive months of declines, chemical shipments rose in January, up by 1.7%. Declining sales in agricultural chemicals, coatings and adhesives were offset by higher sales in other chemical categories. Chemical inventories continued to move lower for a fourth month, down by 0.9%, with declines across all segments (except a small gain in coatings & adhesives inventories). Compared to a year ago, chemical shipments off 2.0% while inventories were 4.7% higher. The inventories-to-shipments ratio fell back sharply from 1.42 in December to 1.38 in January. Inventories are still high relative to shipments, but are moving toward a more balanced position.

At the wholesale level, chemical sales fell 4.0% in January, following a 2.7% fall in December. Chemical wholesale inventories edged lower by 1.6% following a 0.2% decline in December. Compared to last January, sales were down 2.1% Y/Y while inventories were 10.0% Y/Y higher. The inventories-to-sales ratio for chemicals rose from 1.15 in December to 1.18 in January. Last December, the ratio was a lean 1.05.
The U.S. Geological Survey reported that monthly production of soda ash in December was 968 thousand tons, down 4.2% compared to the previous month and down 0.4% Y/Y. Stocks rose 5.2% over November to 364 thousand tons at the end of the month, a 12-day supply. Ending stocks were up 30.9% Y/Y.
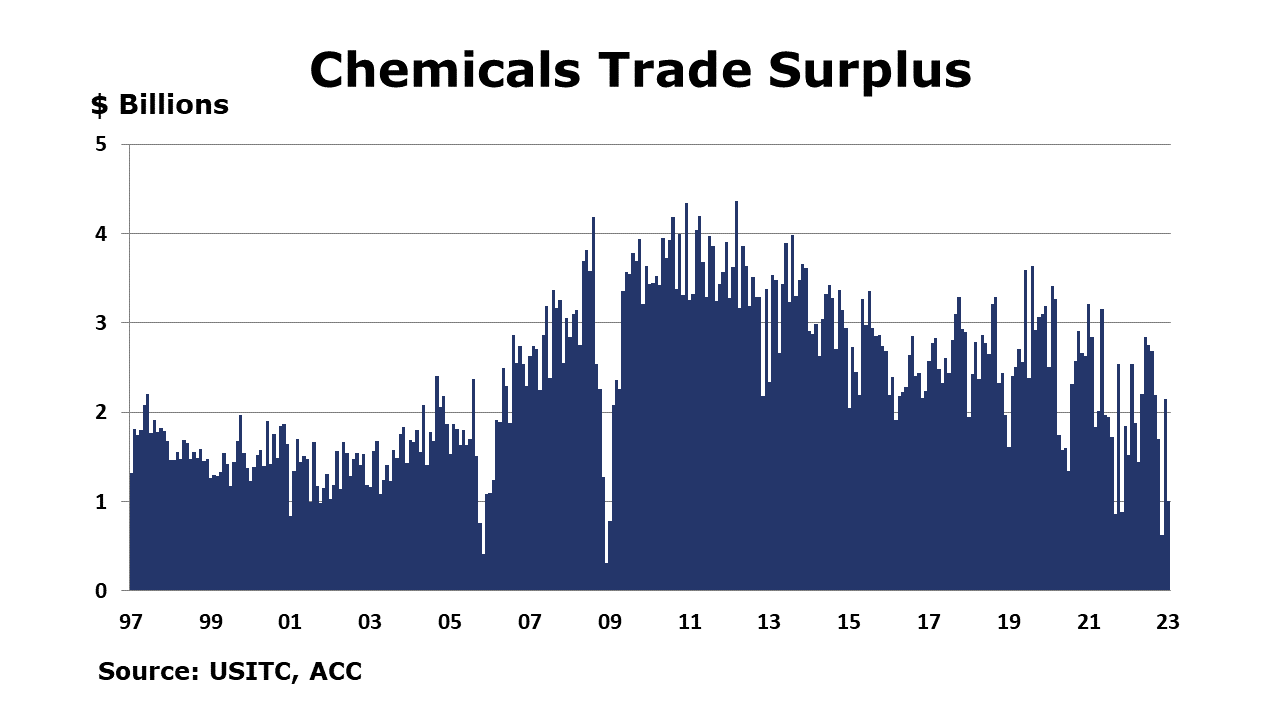
U.S. chemical exports fell 1.6% to $13.5 billion in January, a level down 0.6% Y/Y. Exports of inorganics, agricultural chemicals, consumer products and specialties chemicals were down in January. Exports of petrochemicals rose with a strong gain in plastic resins exports. Chemical imports were strong with an 8.0% gain in January. Imports were up in every chemicals category with the exception of coatings. With imports growing faster than exports, the trade surplus in chemicals contracted by $1.1 billion to $1.0 billion in the month.
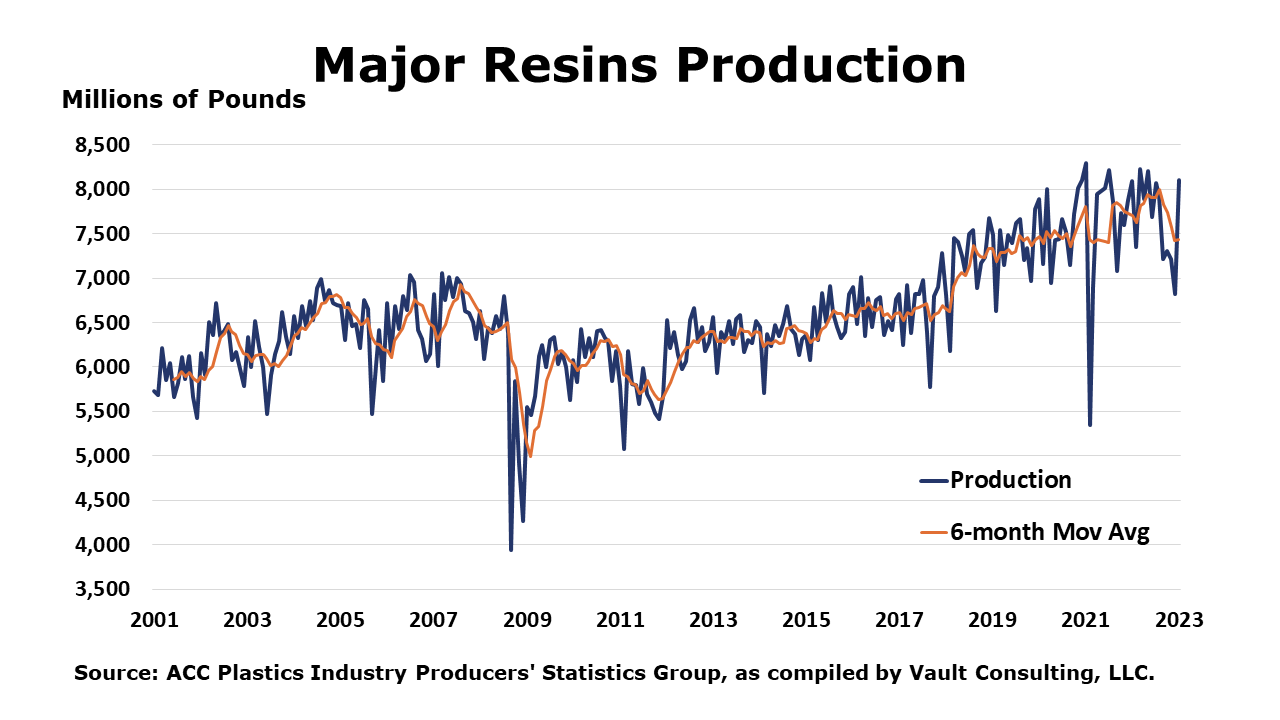
According to data from ACC, U.S. production of major plastic resins totaled 8.1 billion pounds in January, a level up 18.8% compared to December (when some production was disrupted from winter storm Elliott) but flat Y/Y. Sales and captive (internal) use of major plastic resins rose 3.8% to 7.7 billion pounds in January, a level up 5.2% Y/Y.
Chemical industry employment (including pharmaceuticals) rebounded in February, up by 2,500 (0.3%) with gains in both production/non-supervisory and supervisory/non-production jobs. Compared to a year ago, chemical industry employment was higher by 26,900 (3.0%). Average hourly wages for production workers were up 5.6% Y/Y, a slower pace than January’s 7.0% pace of wage gains. The average workweek for chemical industry workers remained stable in February at 41.6 hours and the total labor input into the chemical industry rose slightly February. After factoring in productivity trends, this suggests that chemical output was stable-to-slightly higher which was in contrast with last week’s ISM report that suggested chemical industry output contracted.
Note On the Color Codes
The banner colors represent observations about the current conditions in the overall economy and the business chemistry. For the overall economy we keep a running tab of 20 indicators. The banner color for the macroeconomic section is determined as follows:
Green – 13 or more positives
Yellow – between 8 and 12 positives
Red – 7 or fewer positives
For the chemical industry there are fewer indicators available. As a result we rely upon judgment whether production in the industry (defined as chemicals excluding pharmaceuticals) has increased or decreased three consecutive months.
For More Information
ACC members can access additional data, economic analyses, presentations, outlooks, and weekly economic updates through MemberExchange.
In addition to this weekly report, ACC offers numerous other economic data that cover worldwide production, trade, shipments, inventories, price indices, energy, employment, investment, R&D, EH&S, financial performance measures, macroeconomic data, plus much more. To order, visit http://store.americanchemistry.com/.
Every effort has been made in the preparation of this weekly report to provide the best available information and analysis. However, neither the American Chemistry Council, nor any of its employees, agents or other assigns makes any warranty, expressed or implied, or assumes any liability or responsibility for any use, or the results of such use, of any information or data disclosed in this material.
Contact us at ACC_EconomicsDepartment@americanchemistry.com