MACROECONOMY & END-USE MARKETS
Running tab of macro indicators: 12 out of 20

The number of new jobless claims increased by 28,000 to 261,000 during the week ending June 3. Continuing claims fell by 37,000 to 1.76 million, and the insured unemployment rate for the week ending May 27 was unchanged at 1.2%.
The U.S. trade deficit widened by $14.0 billion to $74.6 billion in April as exports of goods and services fell (down 3.6%) and imports rose (up 1.5%). Exports of industrial supplies and materials (crude oil and fuel oil) and consumer goods were down in April. Imports of autos and parts, industrial supplies and materials, and consumer goods rose in April.
Consumer credit growth continues to gain momentum and was up to a seasonally adjusted annual rate of 5.7% in April. Revolving credit (credit card debt) increased at an annual rate of 13.1%, while nonrevolving credit (auto loans, student loans, etc.) increased at an annual rate of 3.2%.
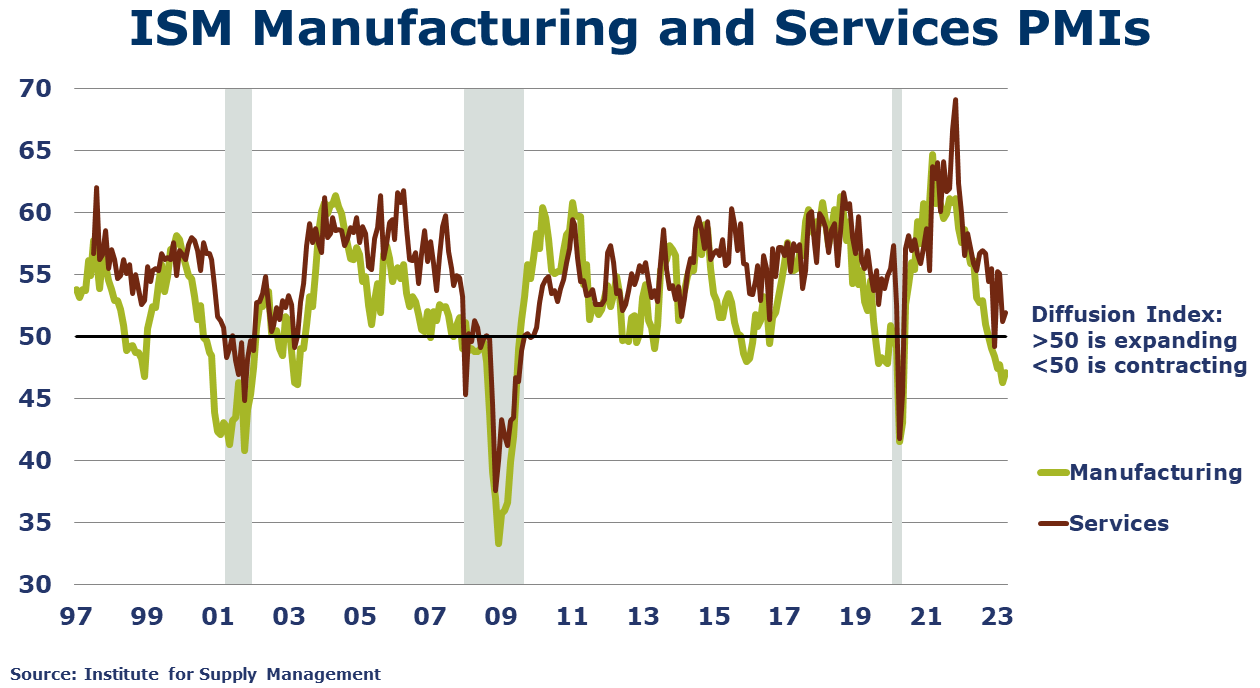
Despite a slower pace than April’s reading, the ISM Services PMI® registered 50.3% in May, indicating continued expansion in the U.S. services sector. Except for a contraction in December, services have grown in 35 of the last 36 months. May’s expansion was primarily due to positive business activity/production, higher new orders, and continued improvements in capacity and logistics, which has had a positive impact on supplier performance. Employment, on the other hand, has shown contraction.
Factory orders continued to expand in April, up by 0.4%. Orders were lower for construction materials, IT goods, and consumer durables. Core business orders (nondefense capital goods excluding aircraft) were up 1.3%. Headline orders were off 1.1% Y/Y while core business orders were up by 1.0% Y/Y. Unfilled orders (a measure of the manufacturing pipeline) rose 0.8% led by defense capital goods. Manufacturing shipments continued to ease and were 0.4% lower while inventories rose 0.5% in April (following a decline in March). As a result, the inventories-to-sales ratio rose from 1.48 in March to 1.50 in April, the highest since September 2021.
ENERGY

Oil prices were trending higher on last weekend’s news of Saudi production cuts. U.S. natural gas prices moved slightly higher compared to a week ago on expectations for hot weather in the next few weeks. The combined oil and gas rig count fell by 15 to 692.
CHEMICALS
Indicators for the business of chemistry bring to mind a yellow banner.
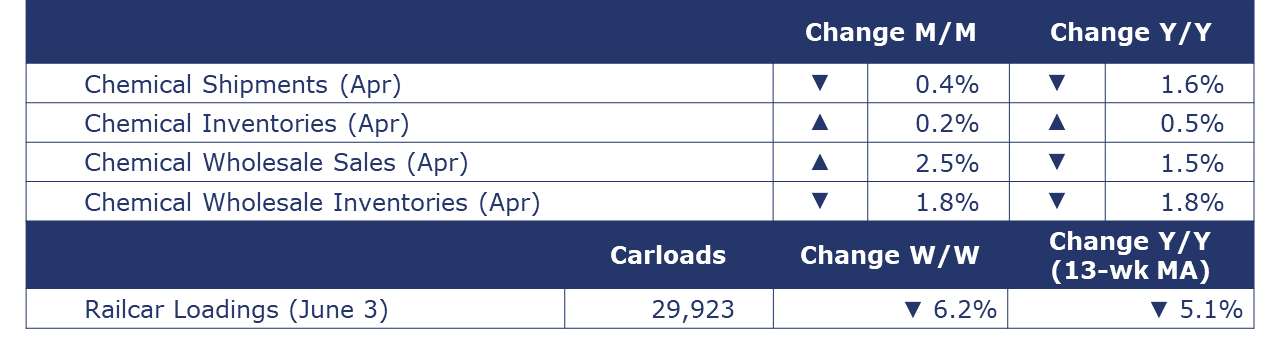
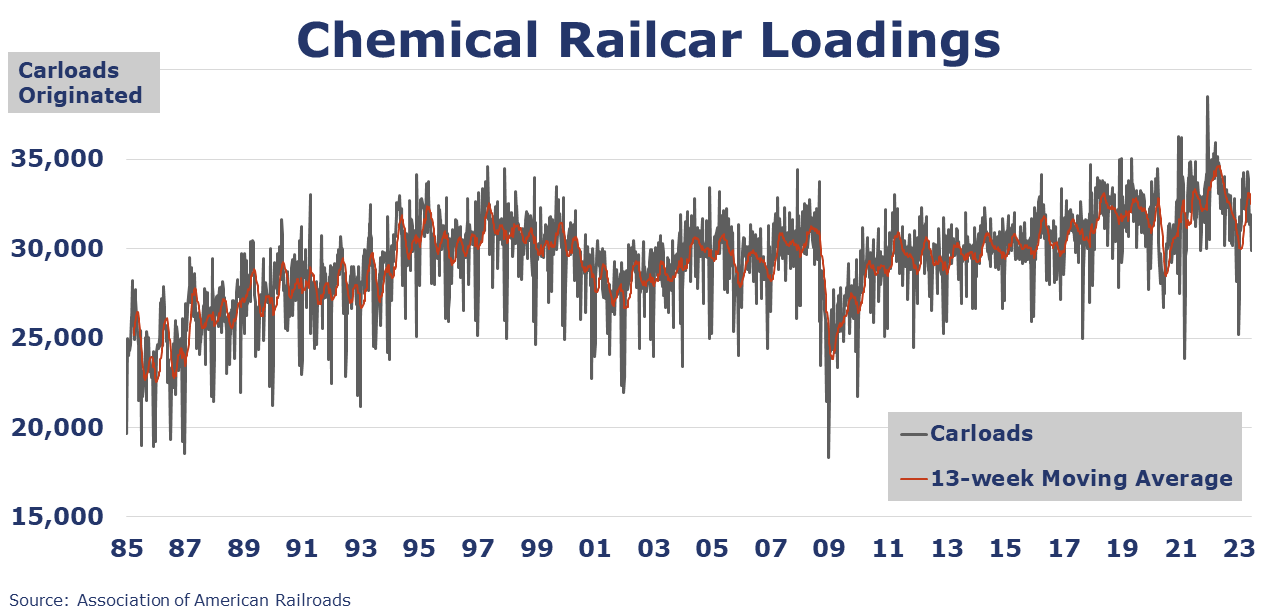
According to data released by the Association of American Railroads, chemical railcar loadings were down to 29,923 for the week ending June 3. Loadings were down 5.1% Y/Y (13-week MA), down (4.9%) YTD/YTD and have been on the rise for 7 of the last 13 weeks.
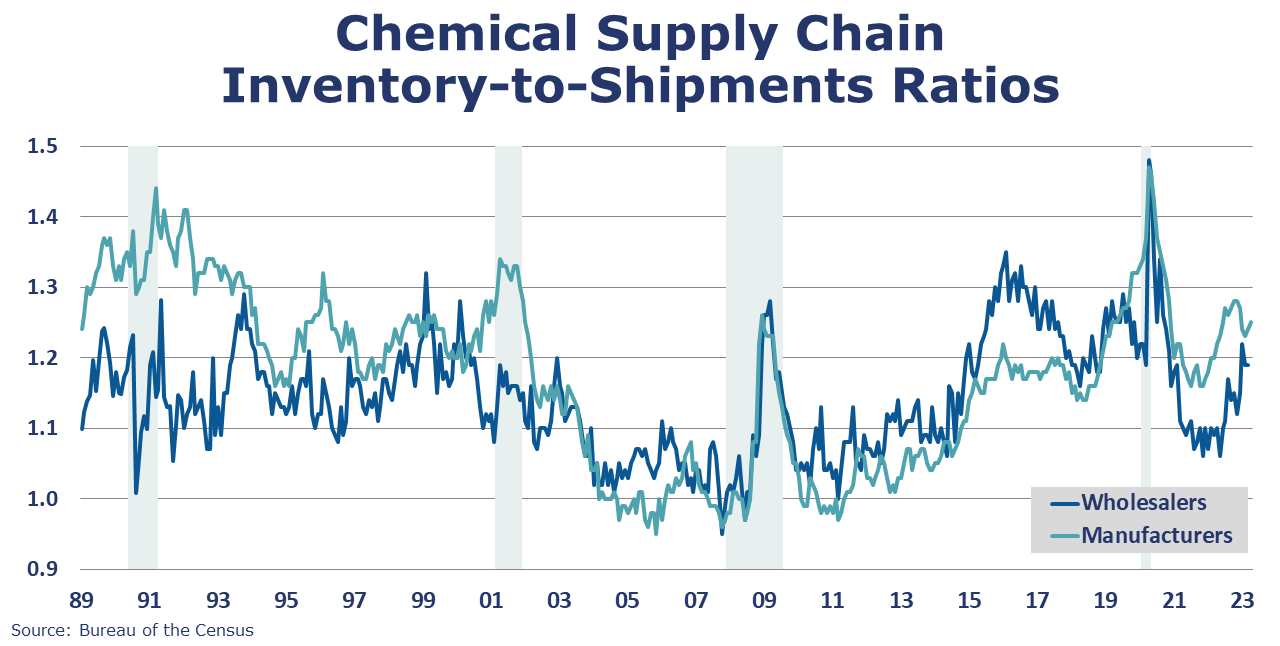
Chemical shipments fell for a second month in April, down by 0.4%. Shipments were lower for agricultural chemicals and coatings & adhesives. Shipments of other chemicals were essentially flat. Chemical inventories rose 0.2% in April, reversing a similar decline in March. Inventories were broadly higher with the largest gain in agricultural chemical inventories. Compared to a year ago, chemical inventories were up 0.5% Y/Y while shipments were off 1.6% Y/Y. The inventories-to-shipments (I/S) ratio edged higher from 1.24 in March to 1.25 in April. A year ago, the I/S ratio was 1.22.
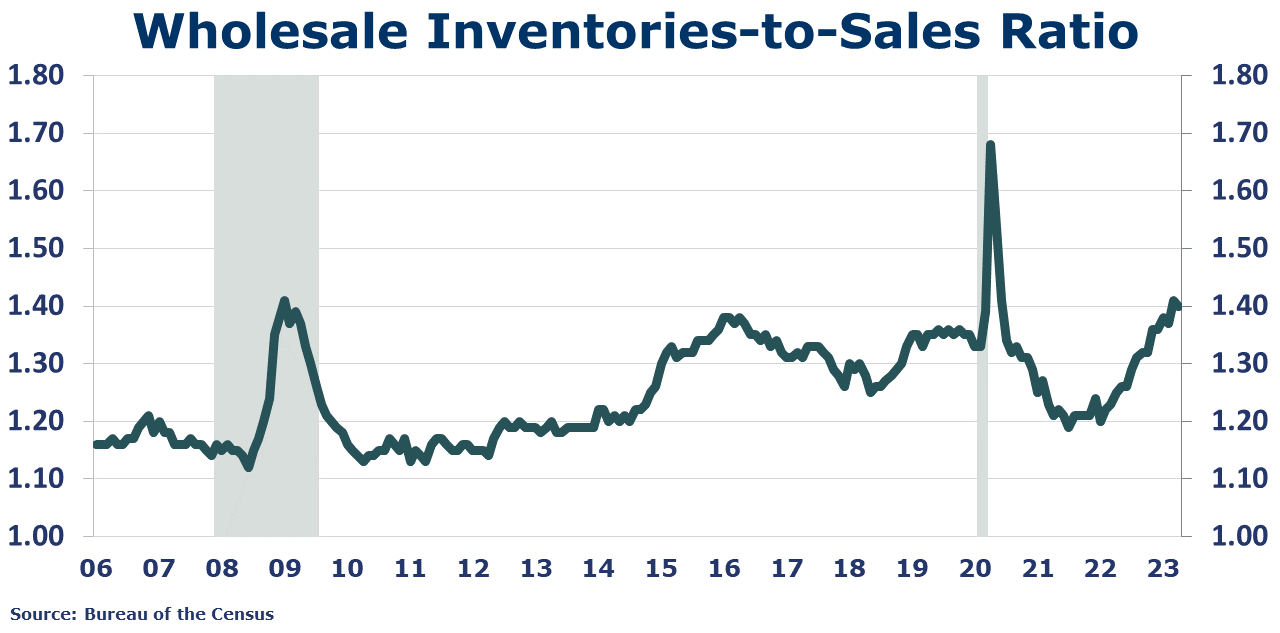
At the wholesale level, chemical sales were up 2.5% in April, following a 0.4% increase in March. Chemical wholesale inventories edged lower by 1.8% following a 0.7% decline in March. Compared to last April, sales were down 1.5% Y/Y, while inventories were 1.8% Y/Y lower. The inventories-to-sales ratio for chemicals edged lower (to 1.12) from March. Last April, the ratio was 1.13.
Note On the Color Codes
The banner colors represent observations about the current conditions in the overall economy and the business chemistry. For the overall economy we keep a running tab of 20 indicators. The banner color for the macroeconomic section is determined as follows:
Green – 13 or more positives
Yellow – between 8 and 12 positives
Red – 7 or fewer positives
For the chemical industry there are fewer indicators available. As a result, we rely upon judgment whether production in the industry (defined as chemicals excluding pharmaceuticals) has increased or decreased three consecutive months.
For More Information
ACC members can access additional data, economic analyses, presentations, outlooks, and weekly economic updates through ACCexchange.
In addition to this weekly report, ACC offers numerous other economic data that cover worldwide production, trade, shipments, inventories, price indices, energy, employment, investment, R&D, EH&S, financial performance measures, macroeconomic data, plus much more. To order, visit http://store.americanchemistry.com/.
Every effort has been made in the preparation of this weekly report to provide the best available information and analysis. However, neither the American Chemistry Council, nor any of its employees, agents or other assigns makes any warranty, expressed or implied, or assumes any liability or responsibility for any use, or the results of such use, of any information or data disclosed in this material.
Contact us at ACC_EconomicsDepartment@americanchemistry.com.